PSX · AUTOMOBILE ASSEMBLER · Explained move
Ghandhara Automobiles
On 14 Sep 2026, GAL fell 4.70% to close at Rs 566.54, on 0.64× its 20-day average volume. It opened 3.26% below the previous close. Its sector moved the same way: the median name fell 2.35%, and 10 of 10 names were down. The KSE-100 fell 1.49% the same day. Across the market, foreign investors sold a net Rs 180.36M, which local investors bought. The move was 1.90× the stock's usual daily move.
Open the chart on 14 Sep 2026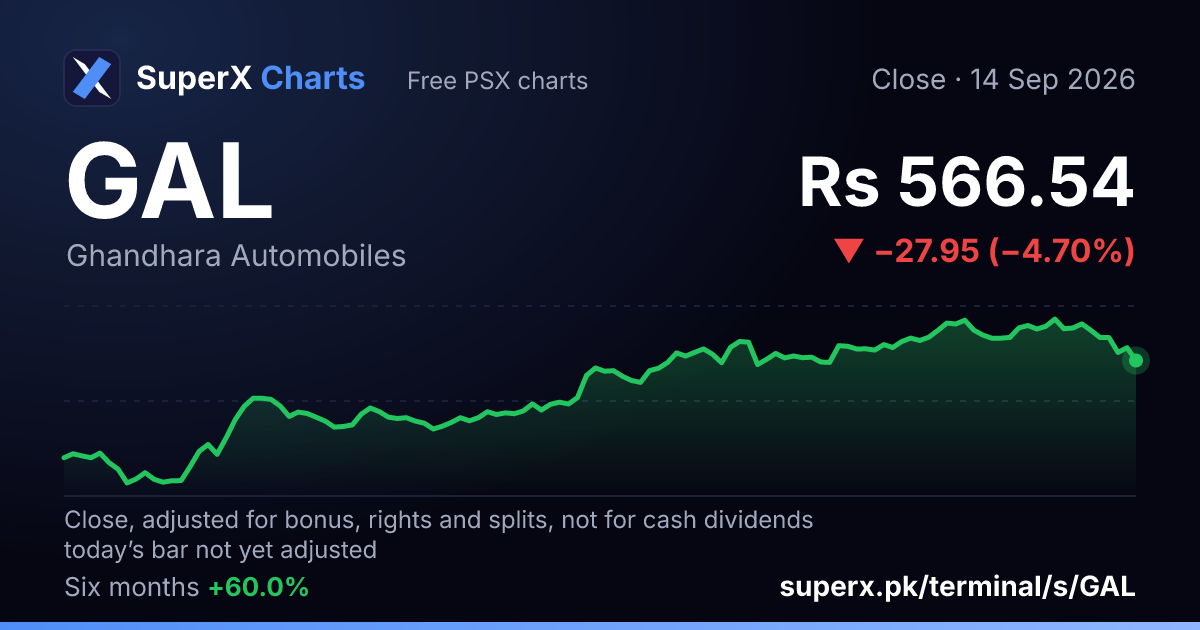
The day's numbers
- Close
- Rs 566.54
- Change on the day
- −4.70%
- Gap at the open
- −3.26%
- Shares traded
- 364,953
- Volume against its 20-day average
- 0.64×
- KSE-100 the same day
- −1.49%
The record's sentence
Down 4.7% on 0.6× the usual volume, gapping 3.3% at the open. The automobile assembler sector moved the same way, median -2.4% (10 of 10 names down). The KSE-100 moved -1.5% the same day.
Source: the explained-move record for the session of 14 Sep 2026, written 19 Sep 2026.
Facts from the exchange. Not advice.